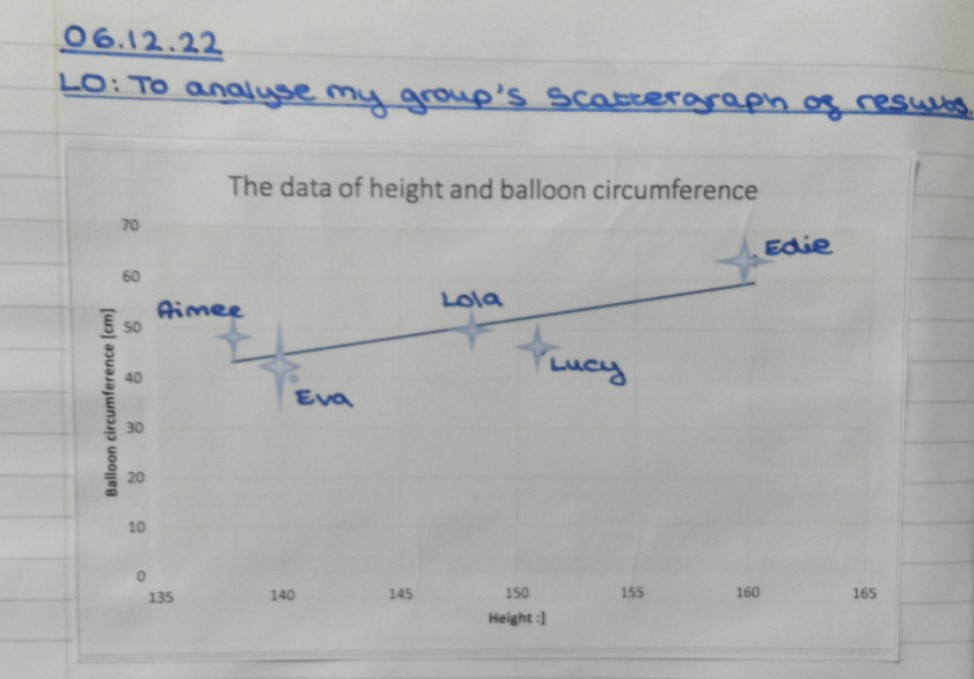
Amongst many other aspects of learning taking place in Year 6 thus week, a highlight was the children learning how to manipulate formulas in spreadsheets and produce their own graphs of results.
Having investigated the question, ‘Do taller people have a larger lung capacity?’, the children tabulated their results and then chose to represent them in the form of a scattergraph! They were also able to include a trendline which was very helpful in them seeing the relationship between height and lung capacity.
Would you know how to do this in Excel?
Have a great weekend
The Year 6 Team